
The 44"hx56w" templates below are compatible with the poster printer in the Harlem Library.
Launch PowerPoint and either choose a template or select Blank Presentation.
Specify the dimensions of the poster before adding content by clicking on the Design tab, then clicking on Slide Size, then Custom Slide Size.
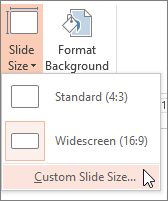
Enter the width and height for your poster. There is no standard poster size. The most common size is 36"x48". Always check the size requirements set by the event. One of the sides must be 44" or smaller to print at the Sirota Memorial Library or 36" for other campuses. Widescreen is the default setting. Choose landscape or portrait.

If you want to use a background color other than white, you can change it by clicking on Design, then  .
.
 . Then click and drag to create a text box. You can change the box size and location later.
 Pictures, Screenshot, or Photo Album icon depending on where your image is stored.
 . Choose the type of chart you want from the dropdown menu. An Excel spreadsheet will open where you can enter your data. If you need to change something in your chart, you can right click on the Chart and go to Edit Data. The benefit of creating a chart in PowerPoint is that the Excel spreadsheet is saved with your PowerPoint file. You can change the data and the chart will resize automatically.
 .
. . Choose a symbol from the dropdown menu to your poster. If the symbols are not placed in your file through the Insert menu, they may not print correctly.
FINALLY, save the file as either PowerPoint or pdf!
Use the Align function in PowerPoint to make sure objects are aligned and distances between them are even. Quick video on using Align


